|
|
UMBC High Performance Computing Facility

Note to readers: 34 tara nodes were in production at
the time of this writing - Dec 29, 2009
Tools for monitoring your jobs
|
|
[araim1@tara-fe1 ~]$ squeue
  JOBID PARTITION     NAME     USER  ST       TIME  NODES QOS    NODELIST(REASON)
   1389  parallel fmMle_no   araim1  PD       0:00     32 normal (Resources)
   1381  parallel fmMle_no   araim1   R      15:52      1 normal n7
[araim1@tara-fe1 ~]$
[araim1@tara-fe1 ~]$ sinfo
PARTITION AVAIL  TIMELIMIT  NODES  STATE NODELIST
develop*     up      31:00      2   idle n[1-2]
long_term    up 5-01:00:00      1  alloc n3
long_term    up 5-01:00:00     31   idle n[4-84]
serial       up   23:30:00      1  alloc n3
serial       up   23:30:00     31   idle n[4-84]
parallel     up   23:30:00      1  alloc n3
parallel     up   23:30:00     31   idle n[4-84]
performan    up   infinite      1  alloc n3
performan    up   infinite     31   idle n[4-84]
[araim1@tara-fe1 ~]$
[araim1@tara-fe1 ~]$ watch sinfo
Every 2.0s: sinfo        Tue Dec 29 12:24:55 2009

PARTITION AVAIL  TIMELIMIT  NODES  STATE NODELIST
develop*     up      31:00	    2   idle n[1-2]
long_term    up 5-01:00:00     82   idle n[3-84]
serial       up   23:30:00     82   idle n[3-84]
parallel     up   23:30:00     82   idle n[3-84]
performan    up   infinite     82   idle n[3-84]
squeue --format '%.7i %.9P %.8j %.8u %.2t %.10M %.6D %.8h %.12L %R'
  JOBID PARTITION     NAME     USER  ST       TIME  NODES  SHARED    TIME_LEFT NODELIST(REASON)
   1389  parallel fmMle_no   araim1  PD       0:00     32       0      4:00:00  (Resources)
   1381  parallel fmMle_no   araim1   R      15:52      1       0      3:44:08   n7
[araim1@tara-fe1 parallel-test]$ scontrol show jobs
JobId=3918 Name=hello_parallel
   UserId=araim1(28398) GroupId=pi_nagaraj(1057)
   Priority=4294897994 Account=(null) QOS=(null)
   JobState=RUNNING Reason=None Dependency=(null)
   TimeLimit=00:05:00 Requeue=1 Restarts=0 BatchFlag=1 ExitCode=0:0
   SubmitTime=2010-02-13T18:31:55 EligibleTime=2010-02-13T18:31:55
   StartTime=2010-02-13T18:31:55 EndTime=2010-02-13T18:36:56
   SuspendTime=None SecsPreSuspend=0
   Partition=develop AllocNode:Sid=tara-fe1:17540
   ReqNodeList=(null) ExcNodeList=(null)
   NodeList=n[1-2]
   NumNodes=2 NumCPUs=11 CPUs/Task=1 ReqS:C:T=1:1:1
   MinCPUsNode=1 MinMemoryNode=0 MinTmpDiskNode=0
   Features=(null) Reservation=(null)
   Shared=OK Contiguous=0 Licenses=(null) Network=(null)
   Command=/home/araim1/parallel-test/openmpi.slurm
   WorkDir=/home/araim1/parallel-test
[araim1@tara-fe1 parallel-test]$ scontrol show jobs --detail
JobId=3918 Name=hello_parallel
   UserId=araim1(28398) GroupId=pi_nagaraj(1057)
   Priority=4294897994 Account=(null) QOS=(null)
   JobState=COMPLETED Reason=None Dependency=(null)
   TimeLimit=00:05:00 Requeue=1 Restarts=0 BatchFlag=1 ExitCode=0:0
   SubmitTime=2010-02-13T18:31:55 EligibleTime=2010-02-13T18:31:55
   StartTime=2010-02-13T18:31:55 EndTime=2010-02-13T18:32:29
   SuspendTime=None SecsPreSuspend=0
   Partition=develop AllocNode:Sid=tara-fe1:17540
   ReqNodeList=(null) ExcNodeList=(null)
   NodeList=n[1-2]
   NumNodes=2-2 NumCPUs=11 CPUs/Task=1 ReqS:C:T=1:1:1
     Nodes=n1 CPU_IDs=4-7 Mem=0
     Nodes=n2 CPU_IDs=0-6 Mem=0
   MinCPUsNode=1 MinMemoryNode=0 MinTmpDiskNode=0
   Features=(null) Reservation=(null)
   Shared=OK Contiguous=0 Licenses=(null) Network=(null)
   Command=/home/araim1/parallel-test/openmpi.slurm
   WorkDir=/home/araim1/parallel-test
[araim1@tara-fe1 parallel-test]$ scontrol show partitions
PartitionName=develop
   AllocNodes=ALL AllowGroups=ALL Default=YES
    DefaultTime=00:05:00 DisableRootJobs=NO Hidden=NO
   MaxNodes=UNLIMITED MaxTime=00:31:00 MinNodes=1
   Nodes=n[1-2]
   Priority=0 RootOnly=NO Shared=NO
   State=UP TotalCPUs=16 TotalNodes=2
...
[araim1@tara-fe1 parallel-test]$ scontrol show nodes | head -n 15
NodeName=n1 Arch=x86_64 CoresPerSocket=4
   CPUAlloc=0 CPUErr=0 CPUTot=8 Features=(null)
   OS=Linux RealMemory=24083 Sockets=2
   State=IDLE ThreadsPerCore=1 TmpDisk=39679 Weight=1
   Reason=(null)
...
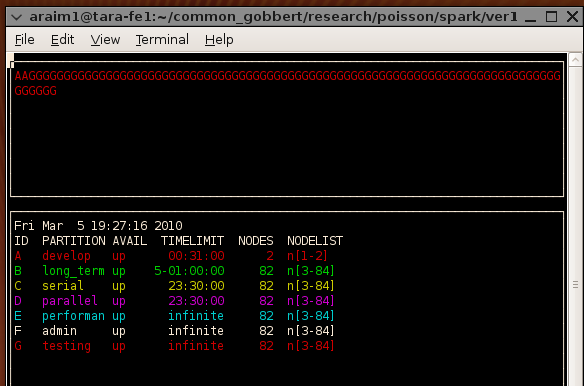
[araim1@tara-fe1 ~]$ smap
 At the top, notice the symbols A, B, C, and "dot", which illustate how
jobs have been allocated on the cluster. There are 84 slots, corresponding
to the 84 nodes currently deployed. The symbols A, B, and C correspond to the
job descriptions below. A dot means that no job is running on that node. We
can also see the queue perspective
At the top, notice the symbols A, B, C, and "dot", which illustate how
jobs have been allocated on the cluster. There are 84 slots, corresponding
to the 84 nodes currently deployed. The symbols A, B, and C correspond to the
job descriptions below. A dot means that no job is running on that node. We
can also see the queue perspective
[araim1@tara-fe1 ~]$ smap -Ds
 This view is slightly misleading. There are two nodes devoted to the develop
queue, but the remaining 82 do not belong exclusively to the performance
queue. As we noted earlier, those 82 nodes are shared among the non-develop
queues. This view also does not display running jobs.
If you would like the display to refresh periodically (say every 1 second)
launch smap with the following
This view is slightly misleading. There are two nodes devoted to the develop
queue, but the remaining 82 do not belong exclusively to the performance
queue. As we noted earlier, those 82 nodes are shared among the non-develop
queues. This view also does not display running jobs.
If you would like the display to refresh periodically (say every 1 second)
launch smap with the following
[araim1@tara-fe1 ~]$ smap -i 1
[araim1@tara-fe1 ~]$ sview
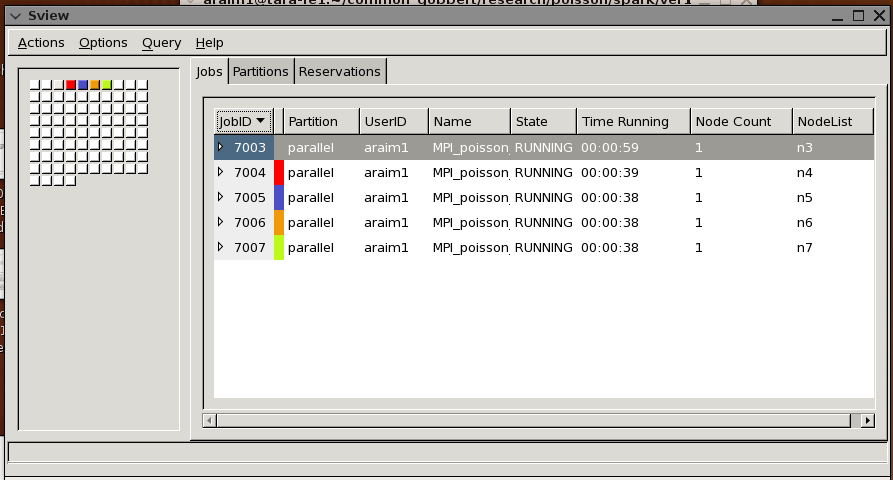 And you may also see the status of the queues
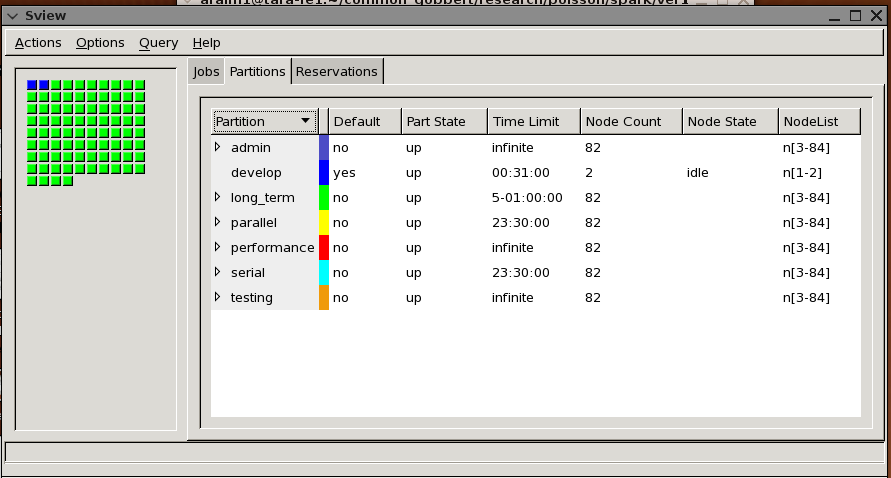 The information shown is similar as in smap, except jobs are identified by
color codes rather than ID symbols. In addition, we can also see queue
usage in this display. In the example above however, all nodes are idle.
The display automatically refreshes periodically.
The information shown is similar as in smap, except jobs are identified by
color codes rather than ID symbols. In addition, we can also see queue
usage in this display. In the example above however, all nodes are idle.
The display automatically refreshes periodically.